Practicality Over Pranks: The Changing Face of College Choice
In recent years, the economic recession has influenced decisions about whether and where to attend college. A new survey we conducted on college choice shows that this trend continues among teenagers despite news that consumer confidence is on the rise.
PriceWeber conducted a survey of 400 respondents, all 17 years old and planning to apply to college. All respondents live in Illinois, Ohio, Missouri, Tennessee, Indiana or Kentucky.
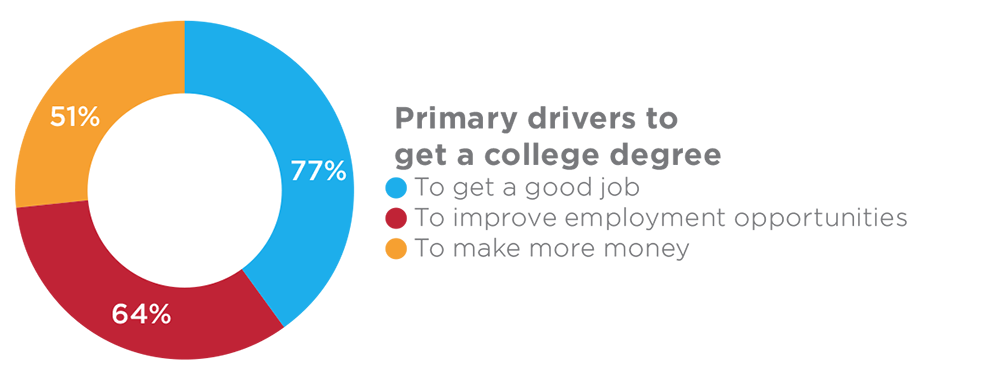
- Graph #1: Primary Drivers to Get a College Degree
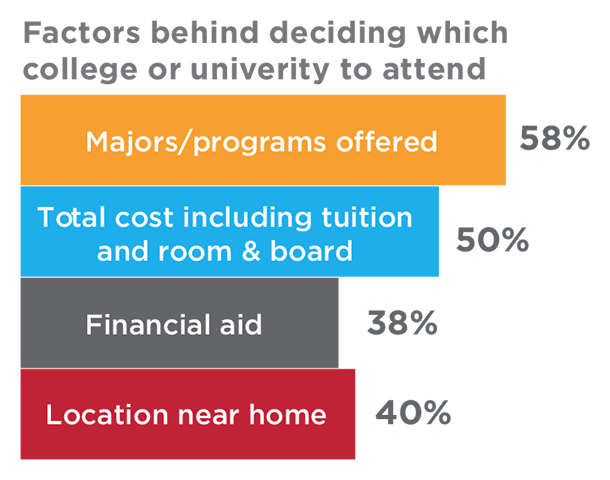
- Graph#2: Factors Behind Deciding Which College or University to Attend
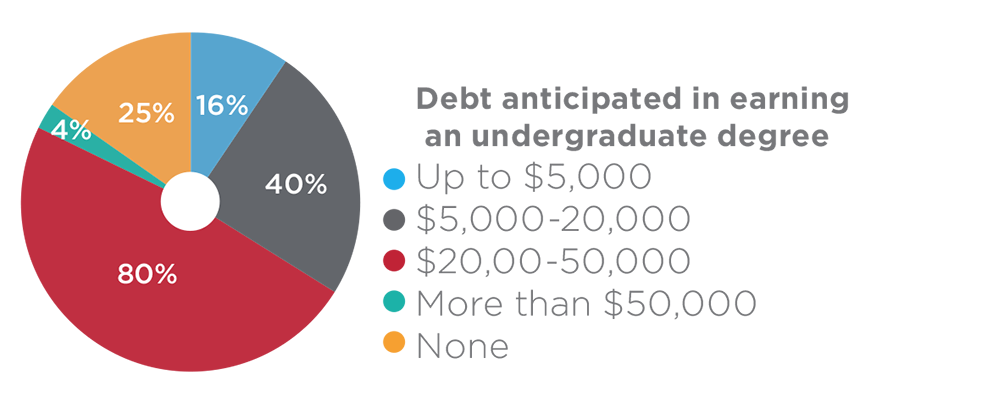
- Graph #3: Debt Anticipated in Earning a College Degree
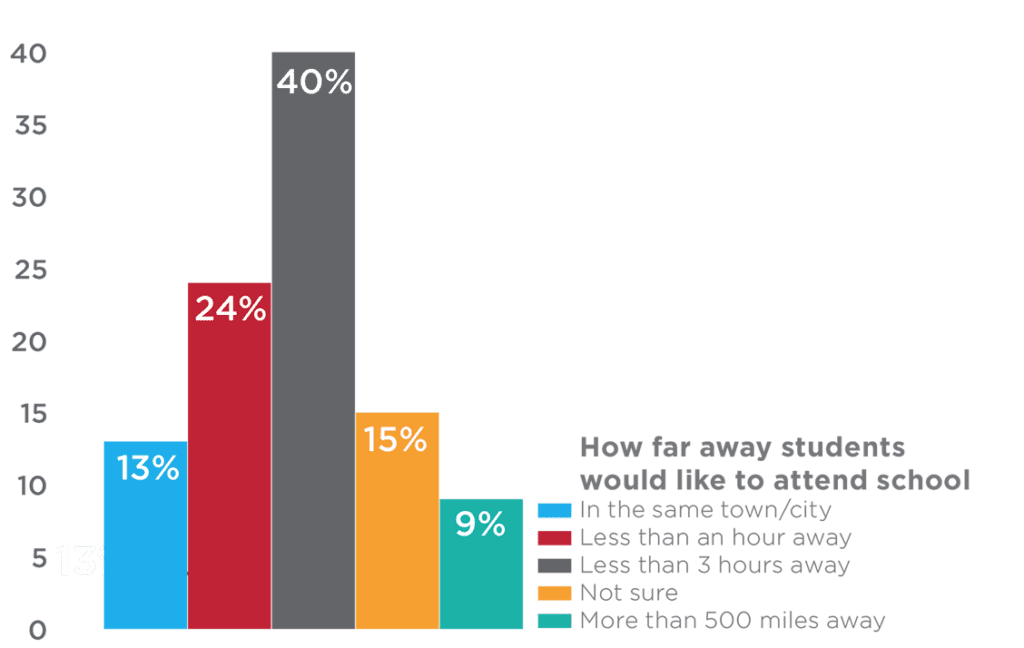
- Graph #4: How Far Away Students Would Like to Attend School
- Get Custom Market Research for Your College or University
A primary finding of this survey was the prioritization of financial concerns behind teenagers’ college choice. Far more than social or personal rationales, consideration of future employment and salary drove decisions to go to college, and which college would earn their attendance.
Graph #1: Primary Drivers to Get a College Degree

Graph #2: Factors Behind Deciding Which College or University to Attend

Graph #3: Debt Anticipated in Earning an Undergraduate Degree

This practicality flows into the logistics of how they conduct their search. When asked what they would most like to see from colleges and universities in marketing materials, primary citations include information about costs and rates, descriptions of majors and degrees, accurate descriptions of students and student life, and statistics regarding graduates’ jobs.
Graph #4: How Far Away Students Would Like to Attend School

Get Custom Market Research for Your College or University
Do you need custom research conducted for your marketing strategy? Give us a shout and let us help you get the data and insights you need.
Our Articles Delivered
Signup to receive our latest articles right in your inbox.

