
Is Marketing Attribution Broken? What Regulated Marketers Should Use Instead

The attribution models built into most marketing platforms were engineered around e-commerce buying behavior, and regulated industries have been forcing that fit ever since. Compliance regulations prohibit much of the tracking these models depend on, and the channels that do the most trust-building in these categories don’t generate clicks. Marketing mix modeling and incrementality testing are better fits, and the good news is that both have become significantly more accessible in the past few years.
Your CFO wants to know what she got for the $2 million you spent on marketing last year. You’ve got a slick dashboard ready to show her: conversion paths, channel percentages, cost-per-acquisition calculated to the penny. Everyone in the room is going to look at the screen and nod.
Everyone in the room is going to privately suspect the numbers don’t reflect reality.
The attribution model behind that dashboard is built for e-commerce. That kind of purchase often starts and ends in a single browser session. But if you’re marketing a hospital system, a manufacturer, or a financial services firm, almost none of that premise holds up. In your world, you’re dealing with six-month buying cycles, multi-stakeholder decisions, compliance-reviewed creative, and federal regulations that make the underlying tracking illegal or unreliable.
Attribution works fine in theory. The problem: one category’s instrument now serves as the default measurement layer for businesses it wasn’t meant to measure. The marketers who keep forcing the fit are building a strategy on fiction.
MTA: A Measurement Tool Not Meant for Your Industry
Engineers created multi-touch attribution around a very specific shopper: someone who opens a browser, researches for a few days, clicks an ad, and buys. The whole MTA model rests on the premise that you can watch that person move through the funnel in close to real time, and that most of what matters happens on a screen you control.
What makes the regulated buying cycle different
HIPAA, GLBA, and state insurance regulations prohibit the kind of behavioral data collection that MTA depends on to work. You can’t run individual-level attribution on data you’re not allowed to collect in the first place. The enforcement landscape since 2023 has made it very clear that regulators are no longer looking the other way:
- Advocate Aurora Health settled for $12.25 million; Mass General Brigham settled for $18.4 million
Financial services has its own version of the problem, just with a different legal architecture underneath. FINRA Rule 2210 requires pre-approval of every retail communication, which kills the fast-iteration loop that attribution-driven optimization assumes is available.
In 2019, the Federal Reserve warned that digitally targeted marketing can raise fair lending risks, meaning that attribution-driven optimization toward “likely converters” can produce disparate impact violations even when the underlying intent is benign. Trustmark National Bank found out the hard way in 2021, when a CFPB and DOJ consent order landed over fair lending violations tied directly to where and how the bank chose to market its products.
The category error in “just extend the window”
The most common response to attribution problems in regulated industries is extending the lookback window. This approach misses the point entirely. A 12-month industrial equipment purchase and a 14-minute sneaker purchase have nothing in common. For example, major equipment decisions get made by committee. The plant manager, the procurement lead, the CFO, and the engineer who has to work with the thing all have a standing in the decision, and they rarely agree on what matters most. Trust is created in-person at trade shows, during site visits, and through phone calls with peers at other plants who already bought what you’re selling. Compliance runs spec sheets and safety claims through legal before a prospect ever sees them. None of that fits inside an attribution window, and extending the window from 30 days to 90 days doesn’t help. You’re still using a model that assumes a straight line on a process that doesn’t have one.
The people selling you the ads are telling you what you want to hear
Google and Meta both report attribution inside their own walled gardens, using their own models, rewarding their own channels. A DTC brand can cross-check those numbers against real conversion data and call out the discrepancy. A marketer who can’t collect individual-level conversion data in the first place has no way to verify any of it. You’re left taking the platforms at their word about their own performance. It’s a conflict of interest so obvious it would be funny if it weren’t driving your budget allocation.
Only 21.5% of marketers are confident last-click attribution accurately reflects long-term platform impact.
(Snap and EMARKETER Media Measurement Survey, September 2024; n=282 US marketers spending $500K+ in digital)
MTA Is the Wrong Default, So Here’s What to Use Instead
Question: Who chose your current attribution model? Did your team evaluate the options and deliberately select multi-touch attribution as the best fit for your industry and regulatory constraints? Or did Google Analytics just come with it turned on?
For most teams, the honest answer is the second one. The most consequential measurement decision in your marketing program was made by a platform, not by you. MTA is what Google and Meta use to report on your campaigns.
Why MMM should be the default for regulated industries
Marketing mix modeling is the more rigorous option, and it’s the one regulated industries should have been using all along. It runs on aggregate spend and outcome data. This means it doesn’t require cookies, individual-level tracking, or any PII. It handles long buying cycles. It captures offline channels that attribution will never see. And because it speaks the econometric language that finance departments trust, it tends to land better in the boardroom.
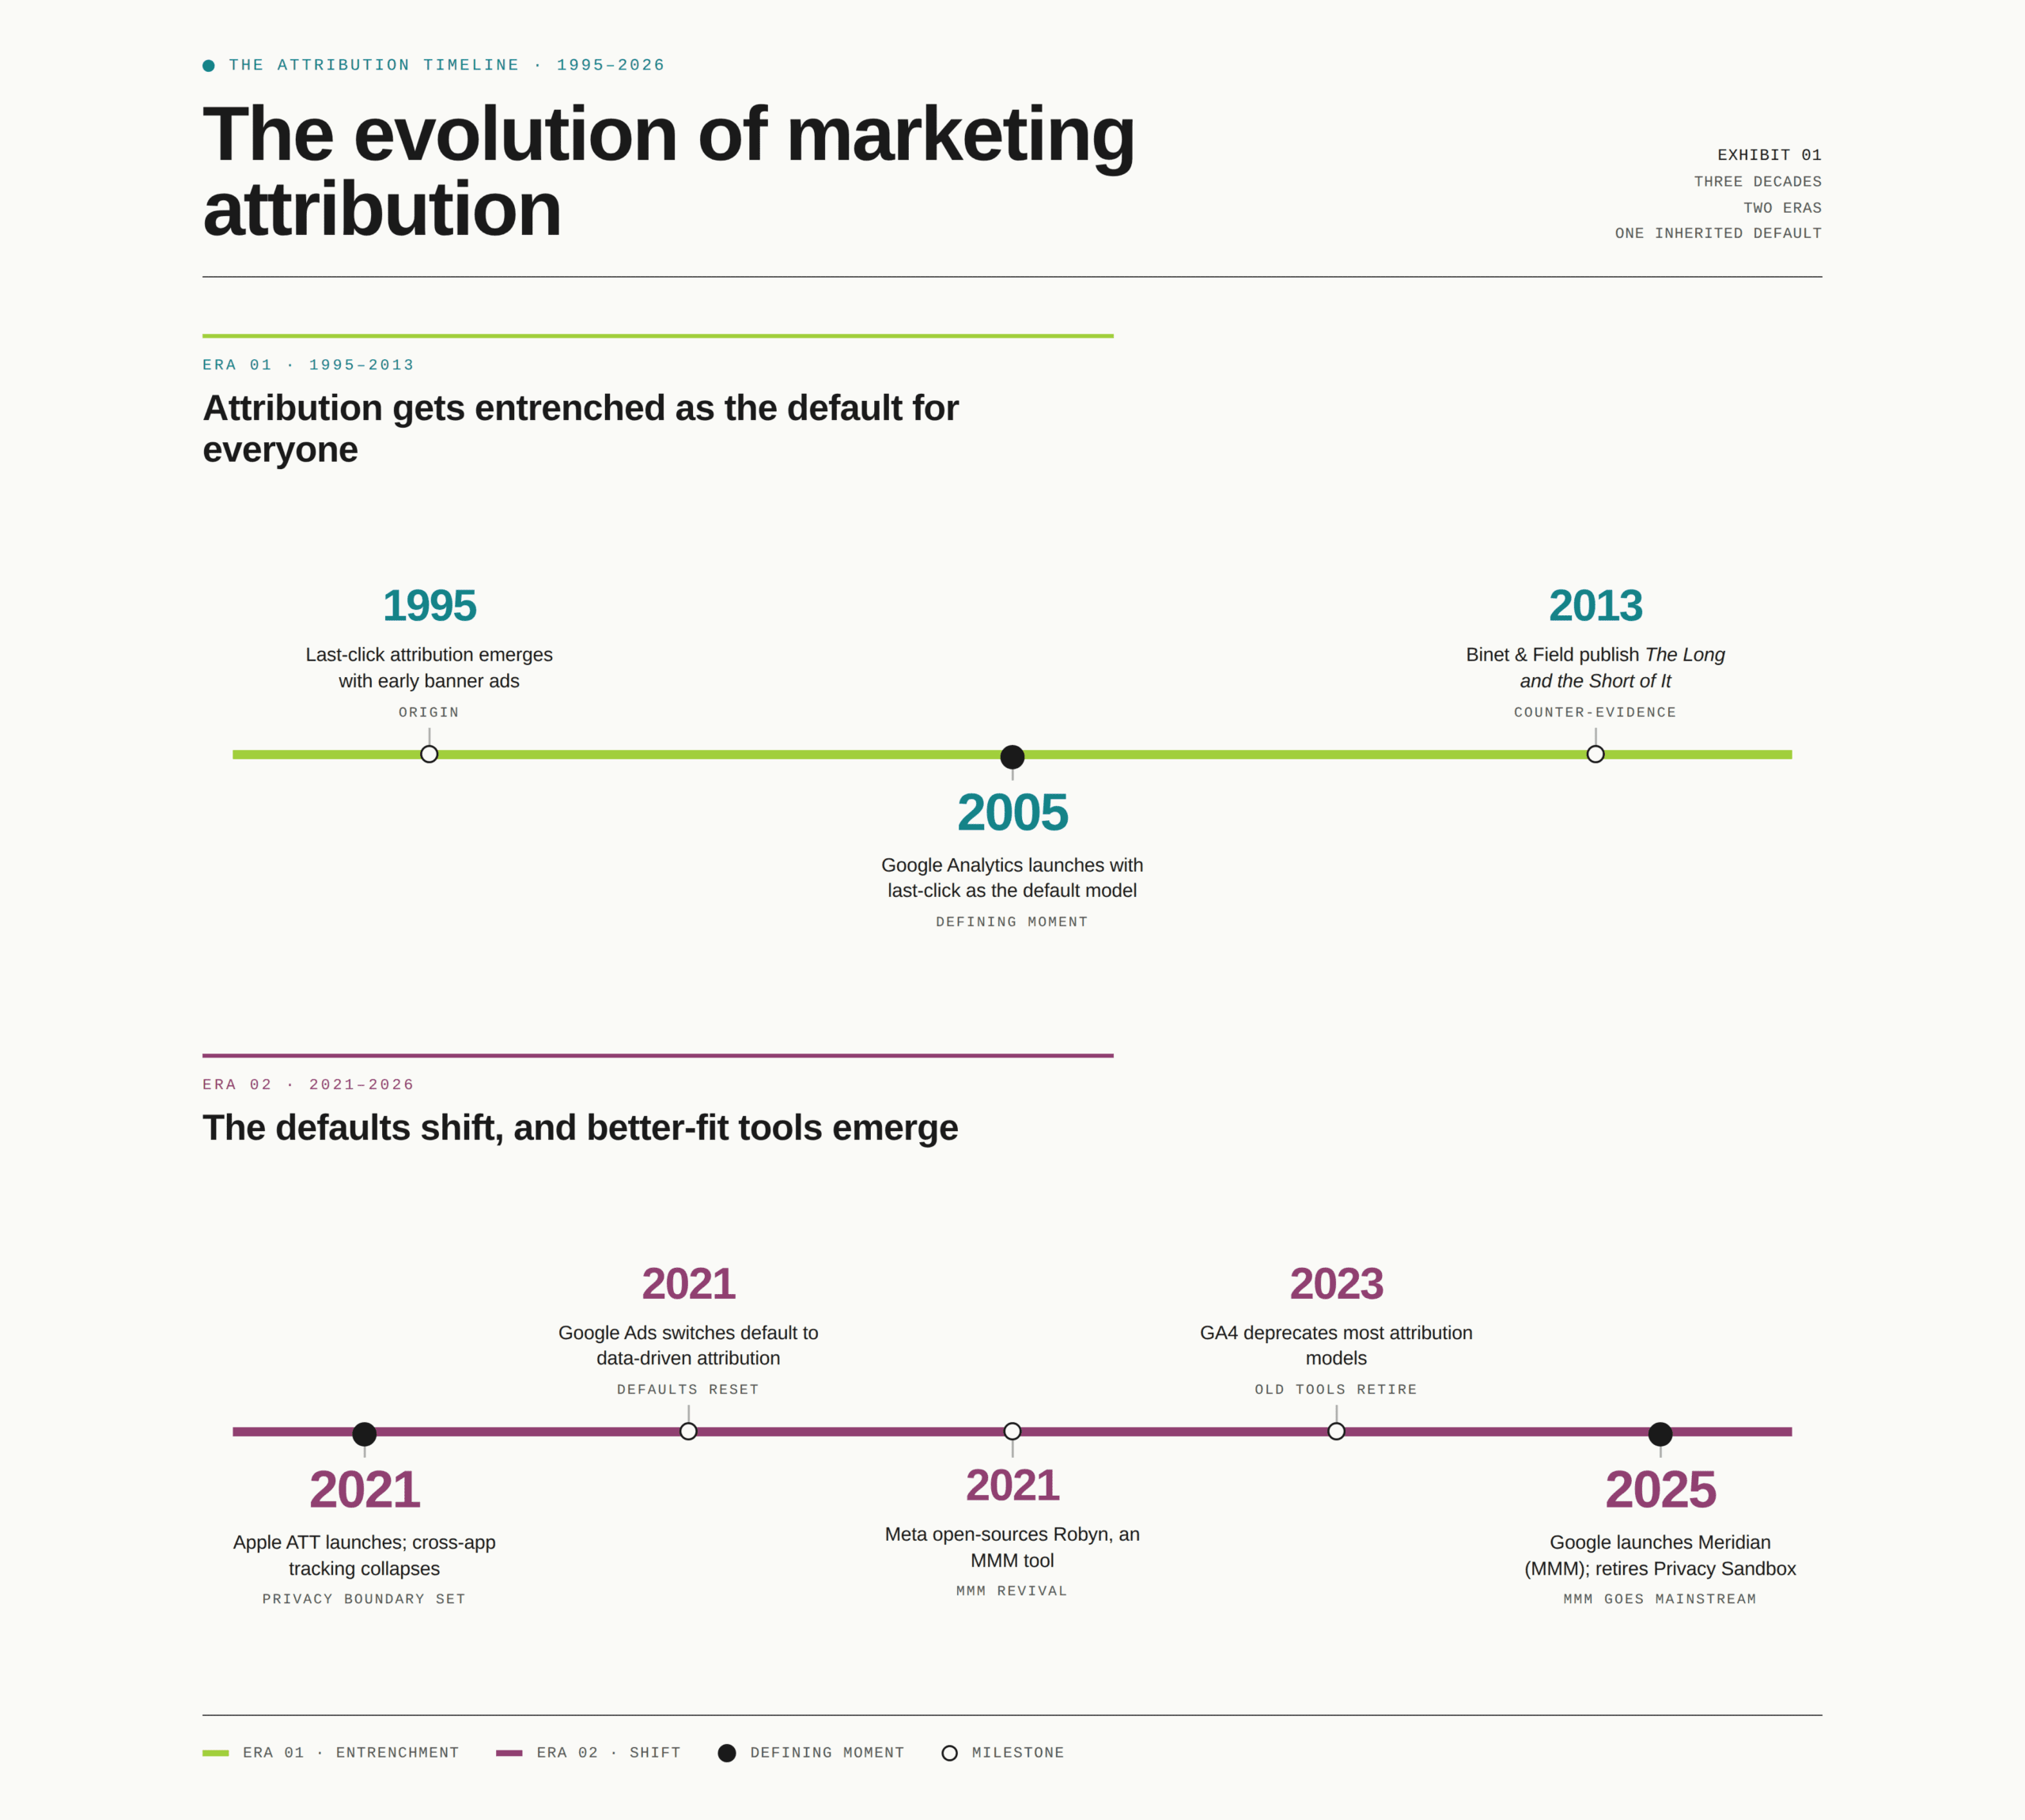
The cost barrier that kept MMM out of reach for mid-market teams has largely collapsed. Meta released Robyn, an open-source MMM tool, in 2021. Google launched Meridian in January 2025. What used to cost $500,000 or more can now be run for roughly $10,000 a year in cloud computing costs. Gartner’s 2024 survey found that 67% of marketing leaders plan to increase investment in MMM, the highest adoption intent of any measurement methodology in the report.
What’s at stake when you don’t use it
The stakes are real. A case study from Circana shows what it costs in practice. A global insurer had no reliable way to measure whether its brand campaigns and sponsorships were contributing to policy sales, because digital attribution gave them little to no credit. The channels didn’t generate clicks.
The team ran an MMM analysis that controlled for market conditions, economic cycles, and competitive activity. It revealed that brand-building channels were driving measurable direct sales growth alongside long-term awareness. The insurer used those findings to concentrate spending on its highest-performing channels and ground future investment decisions in evidence rather than assumption. A team relying solely on their attribution dashboard would have defunded the channels doing the heaviest lifting, with no way of knowing it.
MMM does have real constraints to consider. Building MMM well costs more than pulling a free GA4 report, and it needs at least two years of historical data before it produces outputs you can trust. It also doesn’t work in real time. Those are legitimate barriers. But a structurally flawed model that produces precise-looking numbers isn’t any cheaper to run. It just hides its costs inside the bad decisions it generates.
How to use both tools without letting the wrong one drive
The framework that works for regulated industries is straightforward: MMM as the strategic anchor for budget allocation across channels, and MTA in a narrow tactical role for optimizing digital campaign performance within a channel. That’s the appropriate scope for each. MTA starts causing problems the moment you ask it to do a job its designers never intended — which is exactly what most marketing programs have done.
There’s a third tool that belongs in this conversation. Neither MTA nor MMM answers the question that should matter most to your CFO: Would this conversion happen without the marketing? Unlike attribution models, geo-holdout tests and matched market experiments establish causation. They isolate the effect of marketing from everything else happening in the market at the same time. They’re harder to run than pulling a dashboard report, which is part of why they’re more trustworthy. More than 52% of US brands and agencies now use incrementality testing, and high-performing banks running geo-lift tests routinely find two to three times variation in channel efficiency by region.
If your measurement stack doesn’t include any incrementality work, you have a significant gap in your evidence base.
What to Measure When You Can’t Measure Everything
In a regulated industry, no single signal will ever tell the complete story. Your tracking stack follows one person through one browser session, which describes almost nothing about how your buyers make decisions. Triangulating across several imperfect signals, with documented methodology and honest confidence levels, is a more rigorous approach than a single-source attribution model.
Connect marketing to the outcomes your board tracks
Start by examining where your attribution model’s finish line is. If it ends at a form fill or a landing page visit, you’re measuring marketing activity rather than marketing impact. Policy issuances, member enrollments, loan originations, AUM growth — those are the numbers your board cares about. CRM integration is what closes the gap between the two, connecting campaign data to business outcomes that mean something in a board presentation. Most marketing teams treat it as a nice-to-have, but it’s the difference between a measurement stack that describes activity and one that describes impact.
Brand health belongs in this conversation too, and not as a soft metric that lives in a separate report from revenue. In healthcare and financial services, brand trust precedes every purchase. Consumers evaluating health plans or financial advisors don’t browse the way they shop for running shoes. They eliminate options based on familiarity and trust, then choose from a short list. A brand that doesn’t appear on that short list never gets considered, and no amount of bottom-funnel optimization fixes that. Teams that measure clicks and conversions but don’t track brand health are ignoring the top of the funnel. Without it, none of the rest works.
The signals most teams aren’t using
Source-of-awareness surveys are underused and often more accurate than any pixel. Asking “how did you first hear about us?” at the point of conversion captures channel influence that tracking technology will never reach. This method’s not perfectly scientific, and it relies on self-reported memory, of course. But, on the other hand, it’s unfiltered by a platform’s attribution algorithm and unaffected by the cookie restrictions that corrupt your digital data. In many regulated categories, these answers are the most honest signal available, and cost almost nothing to implement.
As covered in Section 2, incrementality testing is the closest thing to a gold standard in marketing measurement because it’s the only method that answers the question your CFO wants answered: would this conversion have happened without the marketing? Geo-holdout tests don’t require perfect data infrastructure, just discipline and patience. If your team has never run one, skip the feasibility conversation and go straight to why it hasn’t happened yet.
Measurement tools for healthcare
For healthcare specifically, there are compliant measurement tools that most teams either don’t know about or haven’t prioritized. Here are some real- world examples:
- Hedy & Hopp built Epic UTM Connect to bridge marketing attribution data to patient records within Epic’s data warehouse. Over 3,600 US hospitals run on Epic.
- Liine matches session-level marketing data to appointments and production numbers across more than 60 EHR systems, connecting roughly 97% of new patient interactions to a patient record so practices can trace revenue back to a specific campaign or channel.
An overlooked signal in financial services
The financial services industry has its own underused signal: the phone. According to data from BIA/Kelsey and Invoca, phone calls convert to 10-15x more revenue than web leads, and 66% of financial services customers call at some point during the purchasing journey. A measurement stack that doesn’t track calls has a significant gap right where revenue decisions happen.
Precision Is a Trap
There’s an assumption baked into most marketing measurement presentations: that a precise number signals rigor, and that admitting uncertainty signals weakness. That’s backward. A number looks authoritative once a model’s assumptions have shaped it, and it holds up as long as no one asks about those assumptions.
But someone always does.
When a dashboard reports that paid search drove 34.7% of conversions, that number has been laundered through a model’s assumptions until it looks authoritative. If those assumptions don’t reflect how your buyers behave, the precision is actively misleading. You’re making budget recommendations based on a confident fiction.
What directional confidence requires
Presenting directional evidence with documented methodology demands more intellectual honesty than reading a percentage off a dashboard. The question to answer is whether the spend is working, and whether you can prove it well enough to defend it next quarter.
Think about it: Every other function in your organization makes major decisions without complete information. Finance models with stated assumptions, strategy makes bets, and product launches before the market data is in. Nobody calls that a failure of rigor. The CMO who positions marketing measurement as disciplined inference, with honest confidence levels and documented methodology, builds more long-term credibility with the board. The one defending a precise but suspect number doesn’t.
How to make uncertainty defensible
The practical version of this is documentation. Before you walk into the board presentation, document your assumptions alongside your confidence levels, and be clear about where your signals are strong and where they’re thin. That’s what rigorous uncertainty looks like in practice, and it’s considerably more defensible than a dashboard screenshot when the hard questions come.
I don’t think you can find the truth with attribution modeling. It is about figuring out how to be less wrong.
Avinash Kaushik, Chief Strategy Officer at Croud (formerly Google)
You’re Building Strategy on a Broken Feedback Loop
How you measure marketing determines how you fund it. A measurement stack with blind spots will systematically defund the channels it can’t see, whether those channels are working or not.
In practice, digital channels accumulate budget year over year. Meanwhile, the broker relationship, the employer benefits presentation, the community sponsorship, and the print piece that compliance spent six weeks reviewing get treated as unaccountable overhead. Those channels don’t show up in the dashboard. Defunding them because they’re hard to measure is how you hollow out the demand that your measurable channels are capturing.
The 95% you’re not measuring
Professor John Dawes of the Ehrenberg-Bass Institute documented what’s become known as the 95-5 rule: at any given time, only about 5% of potential buyers are actively in-market. The other 95% won’t be purchasing for months or years, and advertising won’t change that timeline. This finding runs parallel to Binet and Field’s landmark IPA research, drawn from roughly 1,000 effectiveness case studies across 700+ brands. Their work established that long-term brand investment consistently outperforms short-term activation over meaningful time horizons.
Attribution models find and convert the 5%, and within that narrow scope, they perform reasonably well. The 95%, the future buyers whose decisions are being shaped right now by brand familiarity and reputation, sit entirely outside what those models can measure, which means they also sit outside what gets funded. The pipeline consequences of that gap tend to show up slowly, and by the time they do, the connection to measurement philosophy is hard to trace.
That’s the feedback loop working against you. A measurement stack that can only see demand capture will always recommend investing more in it. Over time, the channels that create the conditions for capture get defunded, and the whole system gets less efficient in ways a dashboard will never flag.
Build measurement into the campaign before it runs
The practical fix starts before the campaign launches. Holdout markets, source-of-awareness surveys, pipeline tracking, and brand health measurement all require upfront planning to generate usable data. When you design a campaign purely for execution and figure out measurement afterward, you end up with a very specific kind of dashboard. It looks full of data and answers none of the important questions. The decision about how you’ll know if something worked belongs in the briefing room, before the campaign launches.
How to Defend Marketing ROI to the Board (Without Defending Numbers You Don’t Believe)
But there’s good news. The board conversation most CMOs dread is winnable. The CMOs who succeed change the terms of the conversation instead of searching for more defensible numbers.
Lead with business outcomes and work backward to marketing’s contribution.
The framing matters as much as the data. Start with the business outcome your executive tracks: policy issuances, member enrollments, loan originations, patient volume. Then walk backward to show how your measurement connects marketing activity to that number. The room is already accountable for that number, so meet them there.
Defend your methodology, not your metrics.
Walk the room through how you determined what’s working: the methods you used, the assumptions you made, the confidence level you have in each conclusion, and what you’re recommending as a result. A methodology is considerably harder to undermine than a single number, because it shows your work. When someone pushes back, you’re explaining a process rather than defending a figure, which is a fundamentally stronger position.
Pre-empt the precision challenge by naming the gaps yourself.
If you walk in and say, “Our attribution data has these known limitations, so we triangulate across MMM outputs, incrementality tests, and brand tracking to form directional conclusions,” you’ve done two things. You’ve demonstrated measurement maturity that most teams don’t show. Plus, you’ve made it much harder for someone to undermine your credibility by pointing out what the dashboard can’t see because you already named it.
Use MMM language in leadership presentations whenever possible.
Econometric models are the language of finance. When marketing speaks in regression outputs and confidence intervals rather than last-click attribution, the signal is clear. You’re running marketing as a disciplined investment, not a cost center with a dashboard.
And if you’re not the CMO but the person preparing the analysis, this is how you make yourself indispensable: The ability to reframe the measurement conversation from “here’s what the dashboard says” to “here’s what we know, here’s our confidence level, and here’s what I recommend” is the difference between reporting and strategy.
Stop Borrowing From the Wrong Playbook
Regulated industry marketers have been measuring their businesses with a tool that belongs to a different category, and most of them have known it for years. The dashboard looks authoritative while the numbers give everyone something to point at. But the gap between what the data shows and what people in the room believe keeps widening, one budget cycle at a time.
Closing that gap is a measurement philosophy problem. It means using MMM as the strategic anchor and measuring the signals that reflect how trust is earned: brand health, pipeline outcomes, source surveys, incrementality. It also means holding yourself to a standard of evidence that can survive a hard question in a board meeting.
Start here
Audit your current measurement stack this quarter. Ask whether the person closest to the sale would recognize the customer journey your attribution model describes. If the answer is no, you already know where to start.
MMM is cheaper and more accessible than it has ever been. Incrementality testing is within reach for mid-market teams. Call tracking, EHR integration, CRM-connected measurement, and source-of-awareness surveys are compliance-friendly and underused. The infrastructure exists. You can build a measurement architecture around how the buyers in your industry make decisions. You don’t have to inherit one from your ad platform.
The marketers who get there first will have something most regulated industry CMOs don’t: a measurement system that their CFO believes in.
Ready to Build a Measurement Stack Your Board Believes In?
PriceWeber works with marketers to design measurement architectures built around how regulated buying works, with compliance constraints accounted for from the start. If your current attribution model is answering the wrong questions, we can help you build toward the right ones.
Or, call us at 502-499-4209 to talk with one of our experts today.
Marketing Attribution for Regulated Industries FAQs
Search is a demand capture channel: it picks up conversions from people who were already looking for you. The gap is in what created that demand in the first place. Brand campaigns, broker relationships, employer benefits presentations, and offline channels don’’t generate clicks, so MTA gives them no credit. When a health system or financial services firm runs media mix modeling alongside their attribution data, it’s common to find that brand investment was driving a large share of the search volume the dashboard was crediting entirely to search. Before cutting brand spend to double down on search, run an incrementality test or commission an MMM analysis. You may find that the search performance you’re seeing depends on the brand investment you’re considering cutting.
It depends on what you’re using it for. MTA is reasonably reliable for optimizing digital campaign performance within a single channel: comparing creative, adjusting bids, and identifying which keywords convert. The problem starts when MTA gets used for strategic budget allocation: deciding how much to spend on brand versus activation, which channels to invest in, and whether offline and relationship-driven channels are earning their keep. For those decisions, MTA produces confident-looking answers to questions it was never designed to address, and regulated industry marketers end up making real budget calls based on a model that can’t see most of what’s driving their results. A directional MMM model with honest confidence levels is better suited to those decisions, even if it feels less precise.
MMM is more accessible than most regulated industry marketing teams realize. Meta released Robyn, an open-source MMM tool, in 2021. Google launched Meridian in January 2025. What used to cost $500,000 or more can now be run for roughly $10,000 a year in cloud computing costs. Gartner’s 2024 Marketing Data and Analytics Survey found that 67% of marketing leaders plan to increase MMM investment, the highest adoption intent of any measurement approach in the report. The main requirements are two or more years of historical spend and outcome data, internal or agency capacity to build and interpret the model, and organizational willingness to act on outputs that may challenge existing budget allocations. The technical barrier has dropped considerably in the past few years; getting the organization aligned to act on what the model shows tends to be the longer conversation.
The most useful reframe here is to change what you’re asking attribution data to do. Attribution is built for campaign optimization, and it does that reasonably well. Strategic investment decisions, including how much to spend on brand, belong in a different conversation with different evidence. Start with the business outcome your executive already tracks: policy issuances, member enrollments, loan originations, patient volume. Then walk backward to show how your measurement connects marketing activity to that number. Finance departments build models with stated assumptions all the time, and presenting marketing measurement as disciplined inference, with documented assumptions and honest confidence levels, tends to earn more credibility than a precise percentage someone can poke holes in. If you have MMM outputs, bring them. Econometric language is the native language of finance departments, and it signals that marketing is being run as an investment.
HIPAA restricts individual-level tracking, which is a different problem than measurement itself. Most regulated industry marketing teams conflate the two because their current measurement approach depends on individual-level data, so when compliance restricts that data, measurement feels impossible. The fix is moving to aggregate measurement methods that don’t require following an individual through their journey. Media mix modeling works on aggregate spend and outcome data with no PII involved. Incrementality testing compares geographic regions, not individual users. Source-of-awareness surveys ask the patient or member directly how they found you, which requires no tracking infrastructure at all. For teams that want to connect campaigns to downstream clinical or financial outcomes, tools built specifically for HIPAA environments make that possible without creating compliance exposure. The measurement challenge in healthcare isn’t that the data doesn’t exist. It’s that the tools most teams are using were built for industries where collecting that data is legal.
Attribution assigns credit for a conversion to the touchpoints that preceded it. Incrementality testing goes further: it asks whether the conversion would have happened without the marketing at all. That distinction is important because a customer can encounter multiple touchpoints and still convert regardless of whether the ads ran. Geo-holdout tests and matched market experiments measure what the marketing caused by comparing regions that saw the campaign against those that didn’t. More than 52% of US brands and agencies now use incrementality testing, and the tools have become considerably more accessible for mid-market teams in the past few years. For regulated industries where individual-level tracking is limited, geo-holdout tests tend to be the most practical starting point because they work at the aggregate level with no individual data required.
Start by asking the person closest to the sale – your broker channel lead, your top account manager, your patient access director – to look at your attribution model’s customer journey and tell you whether they recognize it. That answer alone tells you a lot. A few other diagnostic questions worth sitting with: Does your attribution model give any credit to offline channels? Can you trace a conversion back to a business outcome your board cares about, or does the trail end at a form fill? Have you ever run an incrementality test on your highest-spending channel? Is brand health measured, tracked over time, and connected to pipeline or revenue data? The more of those questions that surface gaps, the more likely your budget decisions are to be shaped by a model that can’t see the most important parts of how your buyers make decisions.
Walking in with documented assumptions and honest confidence levels, having already named the gaps, tends to build more durable credibility than defending a precise number when someone pushes on it. Walk in and name your current model’s limitations before anyone else does. Say something like: “Our attribution data has these known gaps, so we’re now triangulating across MMM outputs, incrementality tests, and brand tracking to reach directional conclusions.” That framing positions the change as measurement maturity, which most finance-minded board members will respect. It also removes the most common line of attack on marketing credibility, because you’ve already acknowledged what the model can and can’t see before anyone else raises it.
KEY TAKEAWAYS
- HIPAA, GLBA, and state insurance regulations prohibit the behavioral data collection that MTA depends on. The enforcement record since 2023 makes clear that using it anyway carries real financial risk.
- Google and Meta report attribution using their own models, rewarding their own channels. Regulated marketers have no way to independently verify those numbers.
- Media mix modeling runs on aggregate data, requires no PII, and has become considerably more accessible since Meta and Google released open-source tools in recent years.
- The measurement stack that works for regulated industries uses all three tools in the right roles: MMM for strategic budget allocation across channels, MTA narrowly for optimizing digital campaign performance within a channel, and geo-holdout or matched market tests to answer the causal question neither model can: would this conversion have happened without the marketing?
- Attribution only sees the 5% of buyers who are actively in-market. The channels building trust with future buyers are defunded because they leave no trackable footprint.
- Presenting directional evidence with documented assumptions builds more durable credibility with finance-minded stakeholders than precise numbers that won’t survive difficult questions.
Our Articles Delivered
Signup to receive our latest articles right in your inbox.